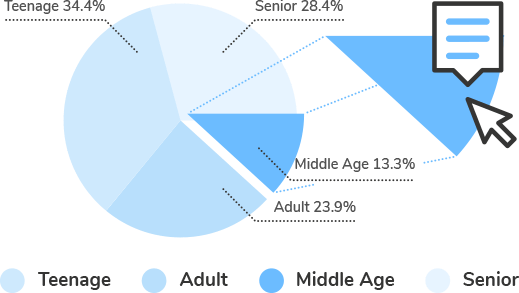
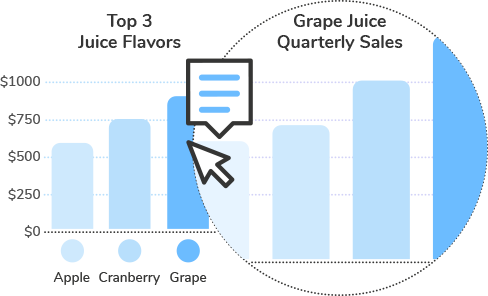
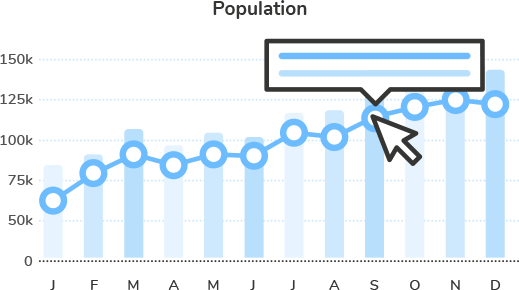
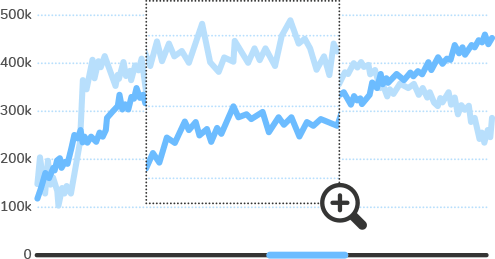
Charts
With 20+ chart types, Froala Charts consists of the most commonly used basic charts such as column, line, and pie for your reports and dashboards.
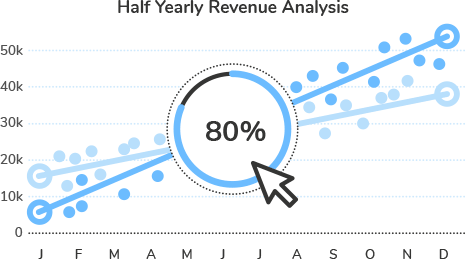
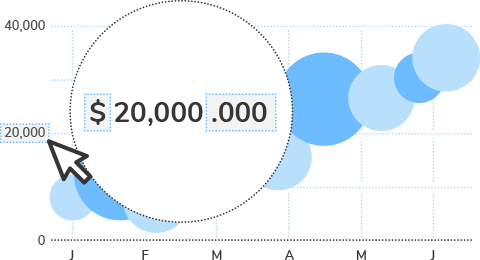
Widgets
From Gauges and KPIs to funnel and pyramid charts, Froala Widgets makes your dashboards and monitors a lot more insightful.
Domain-Specific Charts
Advanced charting using Heat maps, treemaps, radar, statistical charts, and more for domain-specific usage.